Reviewing Social Analytics
The social analytics page includes analytics for videos that were published out to social media sites. To view the Social analytics page:
- Login to Marketing Studio.
- In the primary navigation, click Analytics.
- Click Social at the top of the page
Tabs at the top of the page can be used to access the other analytics pages:
- Web - Includes analytics for videos that were published using a Brightcove Player. See Reviewing Web Analytics for information.
- Individual viewers - Includes analytics for individual viewers. See Reviewing Individual Viewers Analytics for information.
Viewing social analytics
The graph at the top of the page shows the total video views per day for the time period selected.
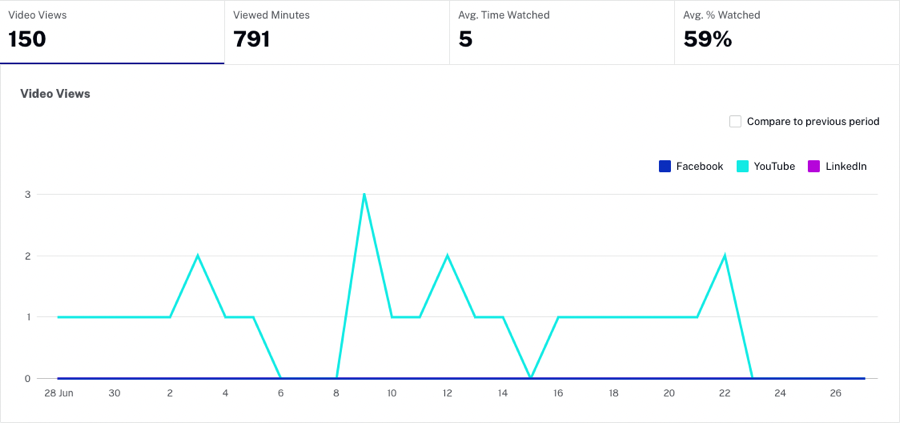
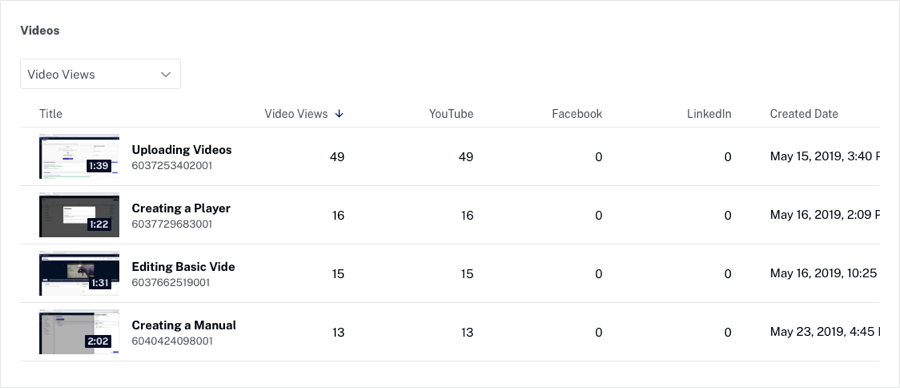
Detailed video analytics will appear below the graph:
- Title - Video name and video ID
- Video Views - The number of times the video started playing, recorded when the stream is started (does not include rewind or replay)
- YouTube - Views on YouTube
- Facebook - Views on Facebook
- LinkedIn - Views on LinkedIn
- Created Date - Date the video was uploaded
Compare to previous period
Selecting the Compare to previous period checkbox will add an overlay dashed line graph representing the data for the previous period.
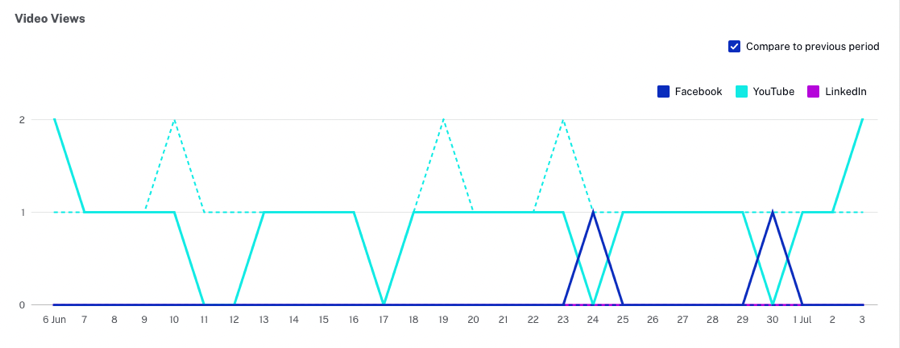
The previous period is based upon what is currently selected for the report date range. For example, if you select a date range of last 7 days, the previous period will be 2 weeks ago. When comparing trends over weeks, it is best to select date ranges that cover complete weeks. For example, if you select a date starting on a Monday, set the end date to a Sunday. If the start date is on a Friday, set the end date to a Thursday. You can also mouse over both the bars and dashed line to see the date and corresponding values.